Are all juices the same when it comes to health impact? Check out this chart of popular options and see for yourself...*Fortified: an unfortified version was not available for analysis.Note: All data are for a single 8-ounce serving.If you were to cut any of these juices with water, splitting the drink 50/50 between the two, then you'd be able to halve the sugar content and calories in a single serving. This would bring the average calorie count from 126 to 63, and the average grams of sugar in a serving from 27 to 13.5.If you'd like to share this chart with your audience, this printable PDF makes a great handout, display element, or email blast!And here are some other great resources from the Nutrition Education Store![shopify embed_type="product" shop="nutrition-education-store.myshopify.com" product_handle="fruit-and-vegetable-challenge-tool-kit-with-powerpoint-shows" show="all"][shopify embed_type="product" shop="nutrition-education-store.myshopify.com" product_handle="freedom-from-chronic-disease-poster-fruit-and-vegetable-promotion-with-statue-of-liberty" show="all"][shopify embed_type="product" shop="nutrition-education-store.myshopify.com" product_handle="12-lessons-wellness-and-weight-loss-program" show="all"]We're here to help you look your very best, right now.
Stephanie Ronco has been editing for Food and Health Communications since 2011. She graduated from Colorado College magna cum laude with distinction in Comparative Literature. She was elected a member of Phi Beta Kappa in 2008.

Juice Comparison Chart
Are all juices the same when it comes to health impact? Check out this chart of popular options and see for yourself...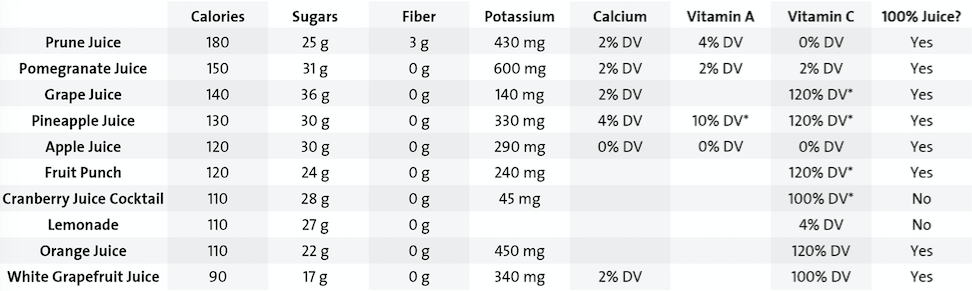 *Fortified: an unfortified version was not available for analysis.Note: All data are for a single 8-ounce serving.If you were to cut any of these juices with water, splitting the drink 50/50 between the two, then you'd be able to halve the sugar content and calories in a single serving. This would bring the average calorie count from 126 to 63, and the average grams of sugar in a serving from 27 to 13.5.If you'd like to share this chart with your audience, this printable PDF makes a great handout, display element, or email blast!
 And here are some other great resources from the Nutrition Education Store![shopify embed_type="product" shop="nutrition-education-store.myshopify.com" product_handle="fruit-and-vegetable-challenge-tool-kit-with-powerpoint-shows" show="all"][shopify embed_type="product" shop="nutrition-education-store.myshopify.com" product_handle="freedom-from-chronic-disease-poster-fruit-and-vegetable-promotion-with-statue-of-liberty" show="all"][shopify embed_type="product" shop="nutrition-education-store.myshopify.com" product_handle="12-lessons-wellness-and-weight-loss-program" show="all"]We're here to help you look your very best, right now.
Stephanie Ronco has been editing for Food and Health Communications since 2011. She graduated from Colorado College magna cum laude with distinction in Comparative Literature. She was elected a member of Phi Beta Kappa in 2008.
The Health Impact of Drinking Juice
August 2016